Utilisation du module « PlotField » pour dessiner des champs de vecteurs et des champs de potentiels.
Le module « PlotField » permet de dessiner des champs vectoriels dans le plan à partir d’une fonction donnant les deux composantes du champ. Il peut aussi être utilisé pour dessiner des champs de gradients, des champs hamiltoniens et des champs de Polya qui sont des champs associés à une fonction à valeurs complexes. Des champs définis par des tableaux rectangulaires de vecteurs peuvent aussi être obtenus.
Le module se trouve dans le répertoire « Graphics » et se charge à l’aide de l’instruction suivante :
Needs["Graphics<span class="base64" title="PGNvZGUgY2xhc3M9InNwaXBfY29kZSBzcGlwX2NvZGVfaW5saW5lIiBkaXI9Imx0ciI+UGxvdEZpZWxkPC9jb2RlPg=="></span>"]
Une fois le module chargé, vous disposez des instructions suivantes pour dessiner des champs :
– PlotVectorField[f, {x, x0, x1, (xu)}, {y, y0, y1, (yu)}, (options)] produces a vector field plot of the two-dimensional vector function f.
– PlotGradientField[f, {x, x0, x1, (xu)}, {y, y0, y1, (yu)}, (options)] produces a vector field plot of the gradient vector field of the scalar function f by calculating its derivatives analytically.
– PlotHamiltonianField[f, {x, x0, x1, (xu)}, {y, y0, y1, (yu)}, (options)] produces a vector field plot of the Hamiltonian vector field of the scalar-valued function f by calculating its derivatives analytically.
– PlotPolyaField[f[x + I y], {x, x0, x1, (dx)}, {y, y0, y1, (dy)}, options] plots the function f in the complex plane using Polya representation.
– ListPlotVectorField[{{vec11,vec12,..},...}] accepts a rectangular array f two-dimensional vectors (larger than 2x2) and displays them, with each vector positioned in the same location graphically as the matrix would be (ie, vector 1,1 in the upper left corner). ListPlotVectorField[{{pt,vec},{pt,vec},...}] displays a list of vectors, each based at the corresponding point.
Les options suivantes sont disponibles :
– ScaleFactor is an option for the PlotField.m and PlotField3D.m functions that scales the vectors so that the longest vector displayed is of the length specified by this option. The default is Automatic; at this setting, those functions that use a coordinate grid (PlotVectorField, etc.) have the vectors scaled so that each fits within the grid without overlapping the base of another vector. If set to None, no rescaling will occur. In ListPlotVectorField, Automatic has the same effect as None. This scaling is applied after ScaleFunction and MaxArrowLength.
– ScaleFunction is an option for the PlotField.m and PlotField3D.m functions that rescales each vector to a length determined by applying a pure function to the current length of that vector. It will ignore vectors of 0 magnitude. Note that because this is applied before the ScaleFactor, this is most useful for resizing the relative lengths of the vectors, and not for linear scaling. This is applied before MaxArrowLength.
– MaxArrowLength is an option for the PlotField.m and PlotField3D.m functions that determines the longest vector to be drawn. The value is compared to the magnitudes of all the vectors and causes all longer vectors to not be drawn. This is applied after the ScaleFunction but before the ScaleFactor. The initial setting is MaxArrowLength->None (no maximum).
Activités
– Dessinez, en utilisant le module « PlotField » le champ suivant :

– Modifiez la présentation du champ en changeant d’échelle :

– Un potentiel est donné par la fonction 1/Sqrt[(x - x0)^2 + (y - y0)^2] avec {x0, y0} = {-1, -1}
- S’agit-il d’un champ scalaire ou d’un champ vectoriel ?
- Dessinez les équipotentielles dans le domaine suivant :
{x, -0.6, 0.4}, {y, -0.6, 0.4} - Dessinez le champ de gradients de ce potentiel.
- Représentez sur un même graphique les équipotentielles et le champ de gradients :
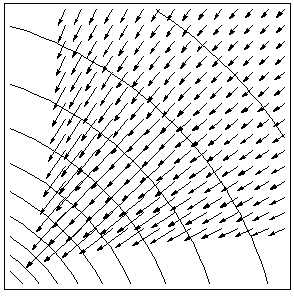
– Donnez une interprétation physique de ce graphique en expliquant ce que représentent les arcs de cercle et les flèches et en indiquant la nature de la source du potentiel et l’endroit où elle se trouve dans les deux cas suivants :
- Le potentiel est un potentiel de gravitation.
- Le potentiel est un potentiel électrique.